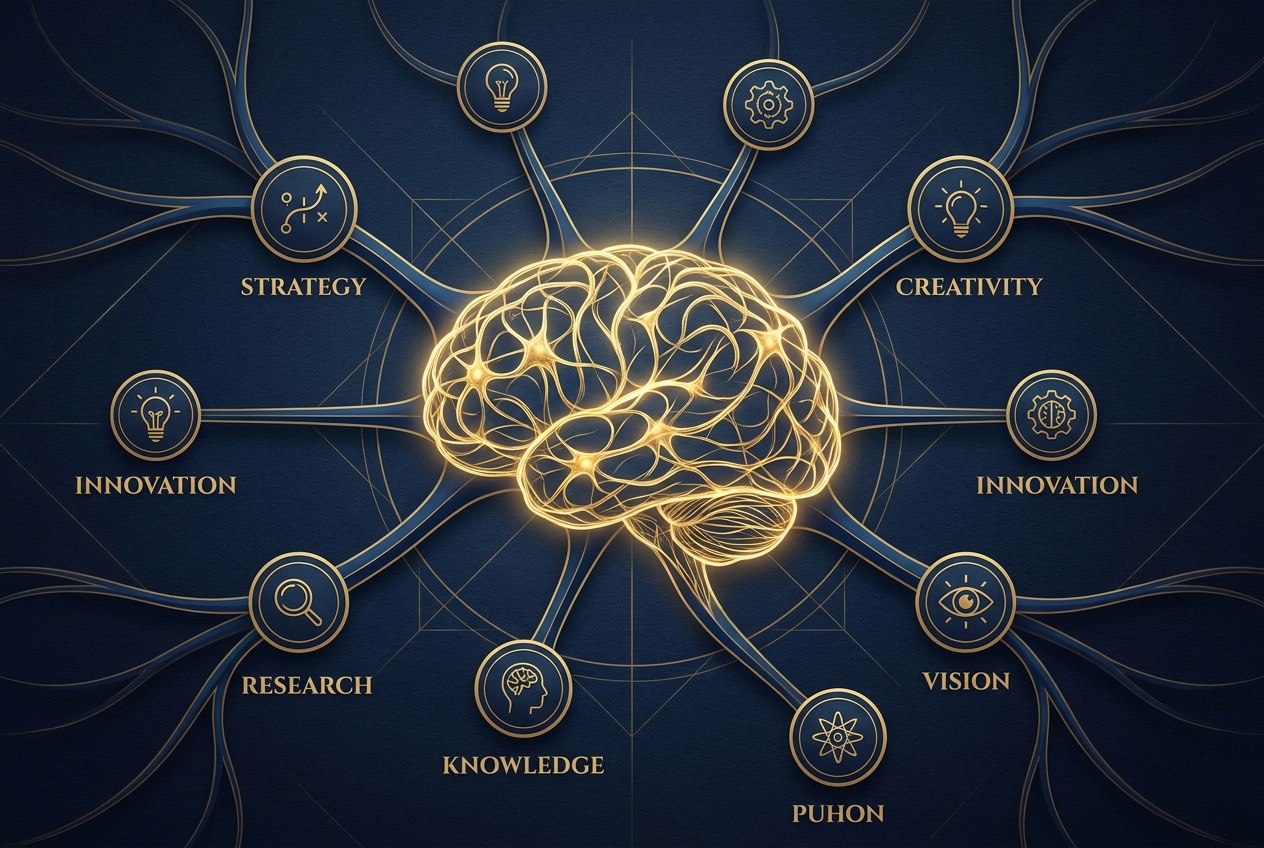
The human brain is not a filing cabinet; it is a sprawling, interconnected forest of neurons. Yet, for centuries, we have forced our thoughts into linear cages—bullet points, rigid outlines, and monochrome lists. This structural mismatch is why we forget 70% of new information within 24 hours. The Master Cartographer knows a better way. To truly master knowledge, we must map it.
In the digital age, information is a deluge. We are bombarded with thousands of data points daily, from emails and Slack messages to whitepapers and industry news. The traditional method of processing this data—sequential reading and linear note-taking—is failing us. It is akin to trying to drink from a firehose with a straw. To manage this complexity, we need a spatial operating system for our minds. Mind mapping is that system.
When we use a mind map, we engage both channels deliberately. By placing a keyword next to a relevant icon or within a color-coded branch, we create 'associative hooks.' This dual coding creates twice as many cognitive paths to the same piece of information. If the verbal memory fades, the visual memory acts as a backup, and vice versa.
Statistics show the power of this approach in academic and professional settings. A landmark study conducted at Johns Hopkins University revealed that students who utilized mind mapping techniques for their coursework saw a 12% increase in their average grades across a single semester. This wasn't just due to better notes; it was due to better *understanding*. The students weren't just transcribing; they were transmuting information into a personal mental model.
Furthermore, research by Farrand, Hussain, and Hennessey (2002), published in the prestigious journal 'Medical Education,' investigated the effectiveness of the 'Buzan' mind mapping technique among medical students. They found that mind mapping improved long-term recall of factual information by up to 15% compared to conventional, linear note-taking methods. In the high-stakes world of medicine, where information density is extreme, a 15% boost in recall can be the difference between a correct diagnosis and a dangerous oversight.
To build a map that adheres to the laws of cognitive cartography, one must master several key elements:
- **The Central Anchor:** Every map must begin with a single, vivid image or keyword in the exact center of the page. This central image acts as the 'nucleus' of your thought process. It should be visually stimulating—perhaps using multiple colors—to trigger the brain's natural curiosity and focus.
- **The Primary Arteries (Basic Ordering Ideas):** These are the thick, flowing branches radiating directly from the center. They represent your main categories, chapters, or fundamental concepts. Think of these as the 'highways' of your mental city. They should be labeled with bold, clear keywords.
- **The Twigs of Detail:** As you move further from the center, the branches become thinner and more numerous. These represent specific facts, dates, supporting evidence, or sub-tasks. The hierarchy is essential; the brain understands importance based on proximity to the center and the thickness of the line.
- **Color Coding as a Semantic Tool:** Color is not just for aesthetics. Using at least three distinct colors stimulates the right hemisphere of the brain, which is responsible for spatial awareness and color recognition. More importantly, color helps in categorization. If all 'Financial' tasks are green and all 'Creative' tasks are orange, your brain can filter information instantly without reading a single word.
- **The Power of Single Keywords:** This is perhaps the most difficult rule for beginners. Use only one word per line. Why? Because a single word is 'open'—it has a vast number of potential associations. A phrase like 'Marketing Strategy' is a closed loop. A branch labeled 'Marketing' with sub-branches for 'Strategy,' 'Tactics,' and 'Budget' allows the brain to explore each area independently, leading to greater creative breakthroughs.
Mind maps are the ultimate antidote to Ebbinghaus’s curve. The reason is 'Scanability.' A linear 10-page report is difficult to review quickly. You have to re-read the sentences, re-process the logic, and hunt for the main points. A mind map, however, can be 'scanned' in 30 to 60 seconds.
Because the map presents the entire landscape of a topic on a single page, you can perform 'high-frequency spaced repetition.' By glancing at your map once a day for a week, you reinforce the neural pathways without the time-consuming drudgery of traditional review. This process 'flattens' the forgetting curve, moving information from short-term working memory into long-term crystalline intelligence.
1. **Define the Scope (The Nucleus):** Start with a blank landscape-oriented page. Place your project name in the center. Let's use 'Q4 Content Launch' as our example. Draw a circle or a simple icon around it.
2. **Identify Core Pillars (The Arteries):** Draw four or five thick branches radiating out. Label them: 'Blog Posts,' 'Social Media,' 'Email Campaigns,' 'Video Production,' and 'Resources.' Use a different color for each branch.
3. **Explode the Branches (The Twigs):** Under 'Social Media,' add sub-branches for 'Instagram,' 'Facebook,' and 'Pinterest.' Under 'Instagram,' add 'Reels,' 'Carousel,' and 'Stories.'
4. **Add Actionable Triggers (The Detail):** Under 'Reels,' you might add 'Draft Script,' 'Film B-Roll,' and 'Caption Hashtags.' Use small symbols—a tiny clock for a deadline, a dollar sign for a budget item—to add layers of meaning without adding text clutter.
5. **The Visual Review:** Once the map is finished, step back. Don't look at the details; look at the shape. Is one side of the map much heavier than the others? This indicates an imbalance in your project planning. Do you see a connection between 'Video Production' and 'Instagram'? Draw a dashed line between them to represent a cross-functional link.
This is not just a study tool; it is a decision-making engine. In a 2016 study by researchers Bobek and Tversky, it was found that creating visual explanations—like those found in complex maps—significantly improves the quality of reasoning and the depth of learning. By externalizing your thoughts, you free up 'cognitive load.' You no longer have to use your brain's energy to *hold* the information; you can use it to *process* the information.
In the corporate world, this manifests as 'Visual Facilitation.' Teams that map out their strategy on a whiteboard or a digital canvas reach consensus faster and report higher levels of engagement. They aren't just talking past each other; they are looking at the same map.
By adopting the role of the Master Cartographer, you are joining a lineage of thinkers who refuse to be limited by the margins of a page. You are choosing to see the connections that others miss. You are choosing to organize your life not as a list of chores, but as a territory to be explored and conquered.
- **Recall Statistics:** Remember the 12-15% boost. Mind mapping isn't a 'soft' skill; it's a scientifically proven method for increasing intellectual performance.
- **Buzan’s Radiant Rule:** Always start from the center and move outwards. Use color, thickness, and hierarchy to guide your brain's attention.
- **Flatten the Curve:** Use your maps as daily 'dashboards.' A 60-second scan is all it takes to stop Ebbinghaus’s forgetting curve in its tracks.
- **One Word, Many Ideas:** Keep your branches simple. Use single keywords to unlock the maximum number of associations and creative sparks.
Summary Maps is built on these foundational principles. We don't just provide summaries; we provide the cartography of cognition. By transforming dense information into visual maps, we give you the tools to reclaim your time, master your mind, and navigate the complex landscape of the modern world with confidence.
Mind mapping mimics this natural biological process. By starting with a central image and branching outwards, you are essentially creating an external 'neural network.' This structural alignment reduces 'cognitive friction.' Instead of forcing your brain to translate its natural radiant process into a linear list, you are providing it with a canvas that speaks its native language.
This is why mind mapping is so often associated with 'Flow State.' When you are in the zone, your thoughts move faster than you can write sentences. A mind map allows you to capture those fleeting associations at the speed of thought. You can jump from one branch to another, add a sub-detail here, a connection there, and the structure holds it all together without losing the thread.
**1. Software Engineering and System Architecture:** Software architects use 'Concept Maps' to visualize the dependencies within a complex codebase. By mapping out how different modules interact, they can identify potential bottlenecks or 'single points of failure' that would be invisible in a linear list of requirements. This visual clarity leads to more robust systems and faster debugging.
**2. Legal Strategy and Litigation:** Trial lawyers use mind maps to prepare complex cases. By mapping out the evidence, witness testimonies, and legal precedents, they can see the 'narrative arcs' of their argument. During a trial, a single-page map allows them to pivot their strategy instantly based on a witness's answer, ensuring they never lose sight of their central objective.
**3. Strategic Planning in Non-Profits:** Executive directors use maps to align diverse stakeholders—donors, volunteers, and staff—around a single mission. The map serves as a 'North Star,' visually demonstrating how every small action contributes to the larger social impact. This visual transparency builds trust and fosters a sense of collective ownership.
**The Analog Experience:** There is a unique 'hand-brain' connection that is activated when you use physical tools. Research in haptics suggests that the fine motor skills required for drawing and handwriting improve memory encoding. Analog mapping is the best choice for brainstorming, self-reflection, and 'deep work' sessions where you want to minimize digital distractions.
**The Digital Advantage:** Digital tools offer scalability and collaboration. You can collapse branches to focus on a specific area, attach PDFs and URLs to individual nodes, and sync your maps across all your devices. For long-term project management and building a 'Second Brain,' digital maps are indispensable.
The ideal approach is a hybrid one: start your brainstorming session with a large piece of paper and colored markers to tap into your creative flow, then digitize the final map to ensure it remains a functional, searchable asset in your professional life.
The secret is to embrace imperfection. A mind map is a draft of your thinking, not a work of art. The Master Cartographer knows that the first map is often messy. It is a 'brain dump' where the primary goal is to externalize the mental noise.
Start with the 'Five Whys' technique. If your central topic is 'Improving Customer Retention,' your first branches might be 'Why are they leaving?', 'Who is staying?', 'What is the competition doing?', 'How do we communicate?', and 'What is our unique value?'. Once those main pillars are on the page, the sub-branches will follow naturally. If you run out of space, just tape another piece of paper to the side. The map is a living, breathing entity that grows with your understanding.
The ethical cartographer strives for 'Visual Integrity.' This means ensuring that the hierarchy of the map accurately reflects the data, and that the connections shown are supported by evidence. A map should clarify, not obfuscate. It should empower the viewer to think for themselves, providing a framework for understanding rather than a prescribed conclusion.
By applying the principles of Dual Coding Theory, leveraging the science of radiant thinking, and building visual summaries to defeat the forgetting curve, you are doing more than just taking notes. You are designing your own cognitive future.
At Summary Maps, our mission is to provide you with the maps you need to navigate the information age. But the most powerful map of all is the one you create yourself. Pick up a pen, find your center, and start mapping. The territory of your mind is waiting to be explored.
In the digital age, information is a deluge. We are bombarded with thousands of data points daily, from emails and Slack messages to whitepapers and industry news. The traditional method of processing this data—sequential reading and linear note-taking—is failing us. It is akin to trying to drink from a firehose with a straw. To manage this complexity, we need a spatial operating system for our minds. Mind mapping is that system.
Why Does the Visual Brain Outperform the Linear Text?
The answer lies in Dual Coding Theory, a psychological concept pioneered by researcher Allan Paivio in the 1970s. Paivio’s research suggests that the brain processes verbal and visual information through two distinct, yet interconnected, channels. When we read a word like 'Apple,' our verbal channel processes the letters and the sound. Simultaneously, our visual channel may conjure an image of a red fruit.When we use a mind map, we engage both channels deliberately. By placing a keyword next to a relevant icon or within a color-coded branch, we create 'associative hooks.' This dual coding creates twice as many cognitive paths to the same piece of information. If the verbal memory fades, the visual memory acts as a backup, and vice versa.
Statistics show the power of this approach in academic and professional settings. A landmark study conducted at Johns Hopkins University revealed that students who utilized mind mapping techniques for their coursework saw a 12% increase in their average grades across a single semester. This wasn't just due to better notes; it was due to better *understanding*. The students weren't just transcribing; they were transmuting information into a personal mental model.
Furthermore, research by Farrand, Hussain, and Hennessey (2002), published in the prestigious journal 'Medical Education,' investigated the effectiveness of the 'Buzan' mind mapping technique among medical students. They found that mind mapping improved long-term recall of factual information by up to 15% compared to conventional, linear note-taking methods. In the high-stakes world of medicine, where information density is extreme, a 15% boost in recall can be the difference between a correct diagnosis and a dangerous oversight.
The Anatomy of a High-Performance Mind Map
Tony Buzan, the modern popularizer and theorist of mind mapping, spent decades researching the mechanics of creative thought. He emphasized that a mind map is not just a drawing; it is a reflection of 'radiant thinking.' Radiant thinking is the process by which the brain generates ideas from a central point, branching out in every direction based on associations.To build a map that adheres to the laws of cognitive cartography, one must master several key elements:
- **The Central Anchor:** Every map must begin with a single, vivid image or keyword in the exact center of the page. This central image acts as the 'nucleus' of your thought process. It should be visually stimulating—perhaps using multiple colors—to trigger the brain's natural curiosity and focus.
- **The Primary Arteries (Basic Ordering Ideas):** These are the thick, flowing branches radiating directly from the center. They represent your main categories, chapters, or fundamental concepts. Think of these as the 'highways' of your mental city. They should be labeled with bold, clear keywords.
- **The Twigs of Detail:** As you move further from the center, the branches become thinner and more numerous. These represent specific facts, dates, supporting evidence, or sub-tasks. The hierarchy is essential; the brain understands importance based on proximity to the center and the thickness of the line.
- **Color Coding as a Semantic Tool:** Color is not just for aesthetics. Using at least three distinct colors stimulates the right hemisphere of the brain, which is responsible for spatial awareness and color recognition. More importantly, color helps in categorization. If all 'Financial' tasks are green and all 'Creative' tasks are orange, your brain can filter information instantly without reading a single word.
- **The Power of Single Keywords:** This is perhaps the most difficult rule for beginners. Use only one word per line. Why? Because a single word is 'open'—it has a vast number of potential associations. A phrase like 'Marketing Strategy' is a closed loop. A branch labeled 'Marketing' with sub-branches for 'Strategy,' 'Tactics,' and 'Budget' allows the brain to explore each area independently, leading to greater creative breakthroughs.
How to Combat the Ebbinghaus Forgetting Curve?
Hermann Ebbinghaus, the pioneering German psychologist and father of memory research, was the first to mathematically describe the decay of knowledge. He discovered that without active reinforcement, memory retention drops off a cliff. His 'Forgetting Curve' shows that we lose almost 50% of what we learn within the first hour, and nearly 80% within a month.Mind maps are the ultimate antidote to Ebbinghaus’s curve. The reason is 'Scanability.' A linear 10-page report is difficult to review quickly. You have to re-read the sentences, re-process the logic, and hunt for the main points. A mind map, however, can be 'scanned' in 30 to 60 seconds.
Because the map presents the entire landscape of a topic on a single page, you can perform 'high-frequency spaced repetition.' By glancing at your map once a day for a week, you reinforce the neural pathways without the time-consuming drudgery of traditional review. This process 'flattens' the forgetting curve, moving information from short-term working memory into long-term crystalline intelligence.
A Step-by-Step Guide to Mapping Your Next Project
Let's move from theory to practice. Whether you are planning a business, writing a book, or studying for a certification, the process is the same.1. **Define the Scope (The Nucleus):** Start with a blank landscape-oriented page. Place your project name in the center. Let's use 'Q4 Content Launch' as our example. Draw a circle or a simple icon around it.
2. **Identify Core Pillars (The Arteries):** Draw four or five thick branches radiating out. Label them: 'Blog Posts,' 'Social Media,' 'Email Campaigns,' 'Video Production,' and 'Resources.' Use a different color for each branch.
3. **Explode the Branches (The Twigs):** Under 'Social Media,' add sub-branches for 'Instagram,' 'Facebook,' and 'Pinterest.' Under 'Instagram,' add 'Reels,' 'Carousel,' and 'Stories.'
4. **Add Actionable Triggers (The Detail):** Under 'Reels,' you might add 'Draft Script,' 'Film B-Roll,' and 'Caption Hashtags.' Use small symbols—a tiny clock for a deadline, a dollar sign for a budget item—to add layers of meaning without adding text clutter.
5. **The Visual Review:** Once the map is finished, step back. Don't look at the details; look at the shape. Is one side of the map much heavier than the others? This indicates an imbalance in your project planning. Do you see a connection between 'Video Production' and 'Instagram'? Draw a dashed line between them to represent a cross-functional link.
Spatial Thinking and the Future of Productivity
Spatial thinking is the ability to visualize and manipulate objects in space. It is one of the most important components of human intelligence, yet it is often ignored in traditional education. When you mind map, you are essentially creating a 2D representation of a 3D mental model.This is not just a study tool; it is a decision-making engine. In a 2016 study by researchers Bobek and Tversky, it was found that creating visual explanations—like those found in complex maps—significantly improves the quality of reasoning and the depth of learning. By externalizing your thoughts, you free up 'cognitive load.' You no longer have to use your brain's energy to *hold* the information; you can use it to *process* the information.
In the corporate world, this manifests as 'Visual Facilitation.' Teams that map out their strategy on a whiteboard or a digital canvas reach consensus faster and report higher levels of engagement. They aren't just talking past each other; they are looking at the same map.
Is Mind Mapping the Key to Unlocking Creative Genius?
Many of history's greatest thinkers used visual mapping techniques, even before Tony Buzan gave it a name. Leonardo da Vinci’s notebooks are filled with central ideas surrounded by radiating sketches and annotations. Charles Darwin used 'tree diagrams' to visualize the evolution of species. These geniuses understood instinctively that the world is not linear, and therefore, their thoughts shouldn't be either.By adopting the role of the Master Cartographer, you are joining a lineage of thinkers who refuse to be limited by the margins of a page. You are choosing to see the connections that others miss. You are choosing to organize your life not as a list of chores, but as a territory to be explored and conquered.
Key Takeaways for the Master Cartographer
- **Dual Coding is King:** Never just write; visualize. Combine text and images to double your brain's processing power and create lasting memory hooks.- **Recall Statistics:** Remember the 12-15% boost. Mind mapping isn't a 'soft' skill; it's a scientifically proven method for increasing intellectual performance.
- **Buzan’s Radiant Rule:** Always start from the center and move outwards. Use color, thickness, and hierarchy to guide your brain's attention.
- **Flatten the Curve:** Use your maps as daily 'dashboards.' A 60-second scan is all it takes to stop Ebbinghaus’s forgetting curve in its tracks.
- **One Word, Many Ideas:** Keep your branches simple. Use single keywords to unlock the maximum number of associations and creative sparks.
Summary Maps is built on these foundational principles. We don't just provide summaries; we provide the cartography of cognition. By transforming dense information into visual maps, we give you the tools to reclaim your time, master your mind, and navigate the complex landscape of the modern world with confidence.
Deep Dive: The Neurobiology of Radiant Thinking
To understand why radiant thinking is so effective, we must look at the physical structure of the brain. The brain is not a linear processor; it is a dense network of billions of neurons, each with thousands of synaptic connections. When an idea is triggered, it doesn't travel in a straight line. It sparks an electrical storm that radiates outwards, activating related clusters of neurons.Mind mapping mimics this natural biological process. By starting with a central image and branching outwards, you are essentially creating an external 'neural network.' This structural alignment reduces 'cognitive friction.' Instead of forcing your brain to translate its natural radiant process into a linear list, you are providing it with a canvas that speaks its native language.
This is why mind mapping is so often associated with 'Flow State.' When you are in the zone, your thoughts move faster than you can write sentences. A mind map allows you to capture those fleeting associations at the speed of thought. You can jump from one branch to another, add a sub-detail here, a connection there, and the structure holds it all together without losing the thread.
Case Studies: How Industry Leaders Use Mental Maps
The application of these techniques extends far beyond the classroom. In high-pressure industries, visual cartography is a survival skill.**1. Software Engineering and System Architecture:** Software architects use 'Concept Maps' to visualize the dependencies within a complex codebase. By mapping out how different modules interact, they can identify potential bottlenecks or 'single points of failure' that would be invisible in a linear list of requirements. This visual clarity leads to more robust systems and faster debugging.
**2. Legal Strategy and Litigation:** Trial lawyers use mind maps to prepare complex cases. By mapping out the evidence, witness testimonies, and legal precedents, they can see the 'narrative arcs' of their argument. During a trial, a single-page map allows them to pivot their strategy instantly based on a witness's answer, ensuring they never lose sight of their central objective.
**3. Strategic Planning in Non-Profits:** Executive directors use maps to align diverse stakeholders—donors, volunteers, and staff—around a single mission. The map serves as a 'North Star,' visually demonstrating how every small action contributes to the larger social impact. This visual transparency builds trust and fosters a sense of collective ownership.
Digital vs. Analog: The Master Cartographer’s Toolkit
A common question is whether to use paper and pen or digital software. The answer depends on your cognitive objective.**The Analog Experience:** There is a unique 'hand-brain' connection that is activated when you use physical tools. Research in haptics suggests that the fine motor skills required for drawing and handwriting improve memory encoding. Analog mapping is the best choice for brainstorming, self-reflection, and 'deep work' sessions where you want to minimize digital distractions.
**The Digital Advantage:** Digital tools offer scalability and collaboration. You can collapse branches to focus on a specific area, attach PDFs and URLs to individual nodes, and sync your maps across all your devices. For long-term project management and building a 'Second Brain,' digital maps are indispensable.
The ideal approach is a hybrid one: start your brainstorming session with a large piece of paper and colored markers to tap into your creative flow, then digitize the final map to ensure it remains a functional, searchable asset in your professional life.
Overcoming the 'Empty Page' Syndrome
One of the biggest hurdles for new mappers is the fear of doing it 'wrong.' Linear note-taking feels safe because there is a clear starting point and a clear path down the page. A blank canvas, however, can be intimidating.The secret is to embrace imperfection. A mind map is a draft of your thinking, not a work of art. The Master Cartographer knows that the first map is often messy. It is a 'brain dump' where the primary goal is to externalize the mental noise.
Start with the 'Five Whys' technique. If your central topic is 'Improving Customer Retention,' your first branches might be 'Why are they leaving?', 'Who is staying?', 'What is the competition doing?', 'How do we communicate?', and 'What is our unique value?'. Once those main pillars are on the page, the sub-branches will follow naturally. If you run out of space, just tape another piece of paper to the side. The map is a living, breathing entity that grows with your understanding.
The Ethics of Information Design
As we become more proficient in visual cartography, we must also consider the responsibility that comes with it. Maps are powerful tools for persuasion. By highlighting certain connections and downplaying others, we can influence how others perceive a problem.The ethical cartographer strives for 'Visual Integrity.' This means ensuring that the hierarchy of the map accurately reflects the data, and that the connections shown are supported by evidence. A map should clarify, not obfuscate. It should empower the viewer to think for themselves, providing a framework for understanding rather than a prescribed conclusion.
Conclusion: Your Journey as a Master Cartographer Begins Now
We live in an era of 'infobesity.' We are over-fed with data but under-nourished in wisdom. Mind mapping is the filter that allows you to distill the noise into a signal. It is the compass that guides you through the complexities of your career, your education, and your personal growth.By applying the principles of Dual Coding Theory, leveraging the science of radiant thinking, and building visual summaries to defeat the forgetting curve, you are doing more than just taking notes. You are designing your own cognitive future.
At Summary Maps, our mission is to provide you with the maps you need to navigate the information age. But the most powerful map of all is the one you create yourself. Pick up a pen, find your center, and start mapping. The territory of your mind is waiting to be explored.